*This post originally appeared on the Jilt blog on Dec. 2, 2020.
Only in the oddest year of our lifetimes could one day be both the biggest online sales day in U.S. history and also a disappointment.
Black Friday/Cyber Monday 2020 is in the books and, as expected, eCommerce spending shattered previous records. However, the spending didn’t shatter those records at quite the levels expected. Strange year, strange results.
So what can we make of this BFCM? We analyzed the overall industry-wide trends, as well as the roughly five million emails stores sent using Jilt, to glean some insights into holiday shopping over BFCM, what might have been 2020-related anomalies, and what trends could stick around for good.
BFCM 2020 breaks records… but falls short of expectations
It’s important to make one thing very clear: People spent a ton of money during BFCM this year, and they spent that money online.
On Black Friday, Americans spent $9 billion online, up 21.6 percent from 2019. That’s a rate of $6.3 million per minute, and $27.50 per person. Also, foot traffic in stores plummeted 52.1 percent year-over-year; a large drop was expected due to the pandemic, but that is still a jarring number to see. While we’re likely to see some recovery post-pandemic, the heyday of in-store shopping may be over: one survey found 52 percent of people say they never plan on doing in-person holiday shopping again. Goodbye, Black Friday stampedes, we hardly knew ye.

Via: Giphy.
As a result of the huge drop in in-store shopping, overall Black Friday sales were down five percent, even with the large increase in online spending.
On Cyber Monday, Americans spent even more: $10.8 billion, up 15.1 percent year-over-year. That makes Cyber Monday 2020 the largest U.S. internet shopping day of all time. However, nothing curbs enthusiasm around a record-breaking result like bloated expectations, and that’s what happened here.
Adobe Analytics, one of the go-to retail industry prognosticators, projected $12.7 billion in Cyber Monday spending. That was $1.9 billion too optimistic. As a result, Adobe has revised its forecast for online holiday spending this year down to $184 billion from $189 billion. Even though that would be a 30 percent increase from 2019 it now somehow feels almost disappointing given the expectations.

Why were these record-breaking BFCM sales results lower than expected? In spite of record spending by many, there was still record unemployment this year; the U.S. employment rate remains double what it was last year at this time. Even for those who didn’t battle unemployment this year, the persistent economic uncertainty could certainly contribute to more cautious holiday budgeting. A Harris poll just before Thanksgiving found 44 percent of Americans planned to spend less on gifts this year and only 10 percent planned to spend more. (Also, self-gifting has become a major part of BFCM spending, and 34 percent of people planned to spend less on self-gifting this year.)
Another possible reason why BFCM spending was down? People were “spent out” by the time it arrived—especially by the time Cyber Monday rolled around thanks to the emergence of early shopping.
Early shopping
The push this year for earlier “Black Friday deals” than ever shifted spending into the days, and even months, before BFCM. In fact, according to the National Retail Federation, 59 percent of Americans had already started their holiday shopping this year by early November.
Amazon’s branded shopping holiday, Prime Day (which lasted for two days), was later than ever this year, pushed from the summer to mid-October due to the pandemic. Americans spent an estimated $6 billion on Amazon during the two-day event in October (“estimated” because Amazon doesn’t release the exact numbers)—up 36 percent year-over-year. In 2019, for contrast, Americans spent just over $4 billion during Prime Day—and that was held in mid-July, so it’s hard to imagine it factored into people’s holiday budgets. But when that spending happens in mid-October? Then it’s cutting close to the holidays. (Important anecdotal evidence: My mother-in-law asked us what we all might want for the holidays this year in advance of Prime Day. Data set of n=1 proves my point.)
On top of Amazon’s big day skimming off the front end of people’s holiday spend, this year’s Prime Day also saw major competing sales from Walmart, Target, Best Buy, and others—so Amazon’s eCommerce market share on Prime Day actually dropped 1.5 percent year-over-year despite its record sales. Online sales for stores not named Amazon grew 76 percent on Prime Day 2020 compared to Prime Day 2019. After it was announced that Prime Day would be delayed until October, Salesforce predicted that it could shift as much as 10 percent of digital revenue from “Cyber Week” to October.
All that is to say: millions of people were already jumping on huge deals online six weeks before Black Friday.
The early spending didn’t end there, either. Virtually all major retailers began offering their Black Friday deals early. Target reported its U.S. eCommerce sales for the month of November leading up to BFCM were up 156 percent year-over-year. Walmart’s were up 120 percent.
And even if some customers held off on the October and November sales, many, at the very least, began shopping on Thanksgiving. Online spending on Thursday in the U.S. jumped 21.5 percent year-over-year to $5.1 billion—a new Thanksgiving day record.
(That earlier push is also reflected in our email data from Jilt stores, which you’ll see in our breakdown later in this article.)
Here are a few other broader eCommerce industry trends that played out during this year’s BFCM.
Mobile shopping… didn’t really grow?
I was fully prepared to write my annual “BFCM mobile shopping went up like crazy again” piece (see: 2018, 2019)—but I can’t. Because it didn’t.
Sales that originated on smartphones jumped 25.3 percent year-over-year to $3.6 billion on Black Friday, for 40 percent of the total eCommerce spend, which sounds significant—but really, that just means they kept pace. In 2019, mobile orders saw 22.2 percent growth to account for 39 percent of revenue.
Shopify found much of the same in its numbers. On this year’s BFCM, 67 percent of Shopify sales were made on mobile; in 2019, it was 68 percent.
Our numbers at Jilt back this up as well. We saw only a marginal jump in the rate of BFCM emails opened on mobile versus desktop from last year (e.g., last year, 57.9 percent of Black Friday emails were opened on desktop, this year it was 55.1 percent).
A phone breaks, unshopped upon. Alone. In the distance, a child cries. Cold rain pounds the window. “City that never sleeps,” I scoff, “Hardly true tonight.” Photo via: Picjumbo.
But… is this a pandemic fluke? Thanksgiving travel was down significantly. With fewer dinners, events, and family gatherings, people everywhere may have had less of a need to escape from a six-hour political debate by going to the bathroom to quickly buy some new shoes. It stands to reason people had more time this year than in years past to sit at home and use their computers to do their BFCM shopping. It’s too early to tell by, oh, roughly 364 days whether this trend will continue next BFCM, but this is definitely a question to keep an eye on: Will mobile eCommerce shopping get back on its growth curve in the future, or has it hit something of a ceiling? The result may be somewhere in the middle: mobile shopping growth hasn’t completely flattened, but perhaps the breakneck growth of the past decade has cooled.
Competing with the giants
The eCommerce market is enormous, on BFCM and beyond, and there’s quite a bit to go around. That being said: the giants of eCommerce seem to be grabbing more and more of the pie, and BFCM 2020 was no exception.
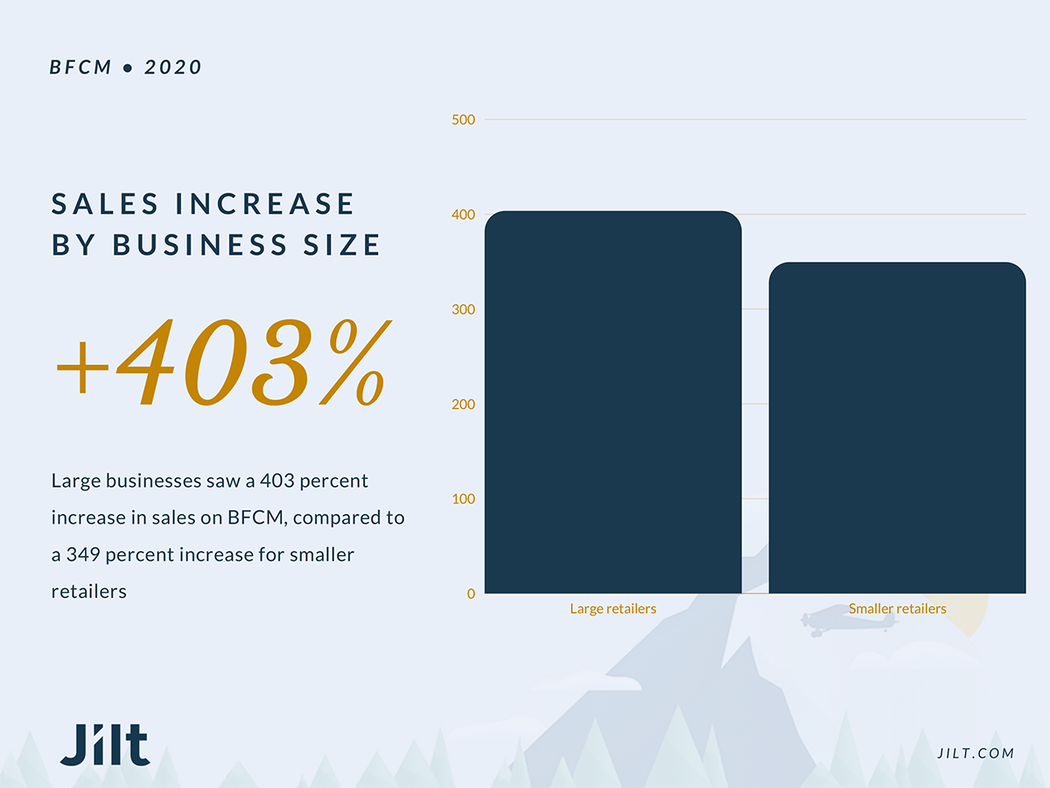
Large retailers saw a 403 percent increase in sales this year compared to their October averages; smaller retailers saw a 349 percent increase. While both numbers are great, it’s another sign that the enterprise brands are continuing to outpace everyone else. (The market share of the top 10 eCommerce brands in the U.S. is currently around 60 percent.)
Non-enterprise eCommerce businesses weren’t just left with scraps over BFCM, however. Shopify (whose data we’ll use as our representative for small-to-medium eCommerce businesses) found its stores did $5.1 billion in sales globally over BFCM 2020—up 76 percent year-over-year. Those businesses also saw a 50 percent year-over-year increase in customers, and the average U.S. customer spent $92.80 when buying from a Shopify store.
Still, the industry giants are growing, not shrinking. That means for the remainder of the holiday season (and beyond), it’s increasingly important for smaller eCommerce businesses to showcase what you can do that the giants cannot. (Check out our article on strategies for beating Amazon during the holidays as a jumping off point.)
Click-and-collect
Click-and-collect (also known as “buy online, pickup in store” or BOPIS), has been around for quite some time—but has seen accelerated growth during the pandemic. The number of orders using click-and-collect jumped more than 500 percent in May of this year, and while BFCM didn’t quite hit those numbers, there was still significant year-over-year growth.
Click-and-collect orders were up 52 percent year-over-year on Black Friday. Click-and-collect should remain popular throughout the rest of the holiday season, especially with more uncertainty than usual surrounding shipping deadlines and reliability.
This year click-and-collect has become a bona fide sales asset. Stores offering the service saw an average increase in online sales of 29 percent on BFCM; stores not offering the service saw only 22 percent average growth. Now that customers have grown accustomed to it, we wouldn’t be surprised if click-to-collect remains popular post-pandemic.
Using BFCM to stock up on essentials
In our analysis earlier this year on BFCM strategies for 2020, we discussed a trend we’d noticed toward practical—some might even say boring—BFCM spending. That is: People aren’t just buying big ticket items on BFCM anymore, they also know they can get potentially once-a-year discounts on necessities like contact lens solution and dog food.
That trend was clearly evident this year, as online pet product purchases on Black Friday jumped 254 percent (compared to October averages), auto parts jumped 269 percent, food purchases jumped 397 percent, and personal care product purchases jumped 556 percent.
Some of that jump can certainly be attributed to the pandemic’s impact on in-store shopping. Taylor Schreiner, a director at Adobe Digital Insights, told CNBC:
“New consoles, phones, smart devices and TVs that are traditional Black Friday purchases are sharing online shopping cart space this year with unorthodox Black Friday purchases such as groceries, clothes and alcohol, that would previously have been purchased in-store.”
However, this customer behavior shouldn’t be attributed solely to the pandemic. Practical BFCM shopping is a trend to watch—and plan around—as customers now recognize BFCM as a great time not just for buying expensive gifts for others, but for buying far less “sexy” utilitarian items for themselves.
Jilt’s Black Friday/Cyber Monday 2020 takeaways
We crunched the numbers on the roughly five million emails (4,952,475 to be exact) stores sent with Jilt over BFCM. We also looked at the numbers from the three-month period leading up to BFCM (August 28th through November 26th) as well as the same data from last year.
Here are our five biggest takeaways.
1. Stores ramped up their email send volume versus last year
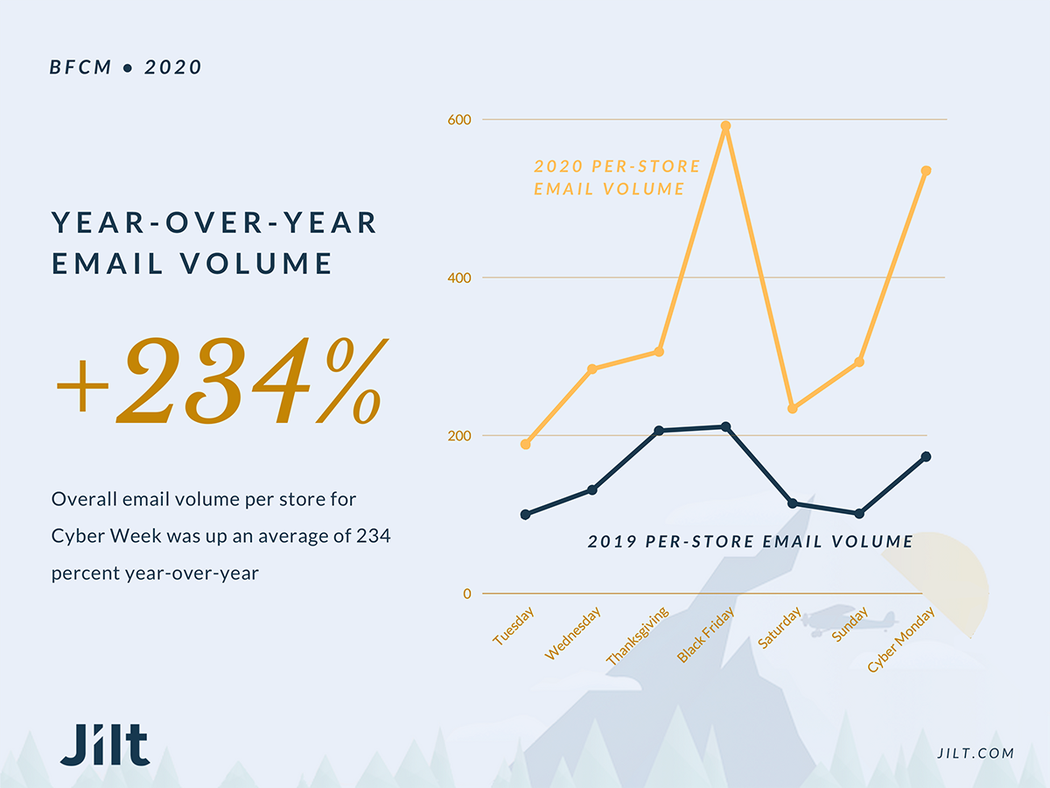
There was a significant jump in the number of emails that stores using Jilt sent on BFCM 2020 compared to 2019. The average store sent 2.8 times more emails on Black Friday 2020 than 2019, two times more on Saturday, 2.9 times more on Sunday, and 3.1 times more on Cyber Monday.
Overall, for Cyber Week of the Tuesday before Thanksgiving through Cyber Monday, the average store sent 234 percent more emails than in 2019.
Opens and clicks on emails, however, were basically static. BFCM emails saw an average open rate of 14 percent and an average click-through rate of 2.53 percent. In the three-month period prior, the average open rate was 15.97 percent and average click-through rate was 2.45 percent. Those results are a mixed bag. On one hand, it’s good that customers continued responding to emails, even as they came in at an increased volume; on the other hand, it can be disappointing to put up your best offer of the year and not see a huge increase in opens and clicks. One thing to remember: On BFCM, you’re not the only one making a bold offer in an email. Every store is making its best offer, so it can be hard to stand out in your customers’ inboxes.
On a purely positive note, the increase in send volume was not met with an increase in unsubscribes, bounces, and/or spam reports—in fact, quite the opposite. The average rate for those three “negative” outcomes over Cyber Week was 11 percent lower than the rest of November. This backs up the idea that BFCM emails are highly anticipated and desired by customers; when a 2x increase in send volume results in a drop in churn, that’s a good sign.
The takeaway: Don’t be afraid to ramp up your send volume on BFCM (after all, your competitors probably are). Your customers should respond well to the increase in sends and you shouldn’t see a large wave of unsubscribes as a result.
2. Confirmed: The 2020 shopping season started earlier
Much like the eCommerce industry as a whole, Jilt stores began their email marketing push earlier in 2020 than in 2019. Stores sent an average of almost two times more emails in the week leading up to Black Friday 2020 than in that same time frame in 2019.
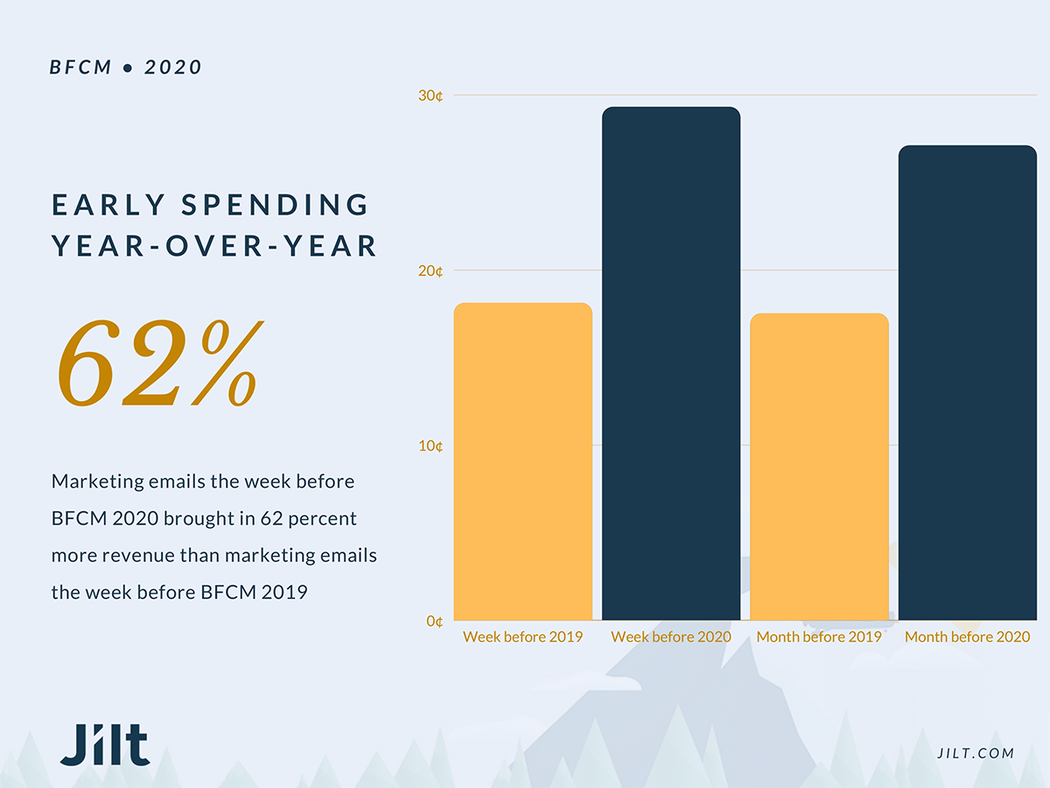
Customers responded favorably to those earlier emails. The average email sent in the week leading up to BFCM 2020 brought in 29.3 cents in attributable revenue; in the week leading up to BFCM 2019, the average email brought in 18.1 cents in attributable revenue. That’s a 62 percent year-over-year increase in revenue-per-email in the week leading up to BFCM.
Backing out even further to include all of November, emails from November 1st through Thanksgiving of 2020 brought in an average revenue-per-send this year of 27.1 cents. During that time period in 2019, emails brought in an average revenue-per-send of 17.5 cents. That’s a 55 percent improvement this year. (The average store also sent roughly two times more emails in November of this year than last year.)
The takeaway: Will the early start to holiday shopping carry over once we’re on the other side of the pandemic? It’s hard to imagine huge retailers and smaller retailers alike wanting to give up that extra revenue they saw this year. Adjust your future holiday plans accordingly, and plan to kick off BFCM earlier rather than later next year.
3. Broadcast emails were more effective than average on BFCM
Broadcast emails, like sales announcements and newsletters, generally bring in less revenue on average than more targeted automated emails. However, over BFCM, broadcasts become more anticipated and relevant than usual—customers expect to get offers from the stores they follow, so they actively monitor their inboxes for those emails.
As a result, there was a big bump in attributable revenue from broadcast emails on BFCM this year.
The average revenue for every broadcast email sent on Black Friday was 21.7 cents. On Saturday, it was 39.6 cents; Sunday, 24.7 cents; and Monday, 22 cents. The overall average revenue for every broadcast email sent over BFCM was 25 cents. The average revenue per broadcast for emails in the three months prior? 16.7 cents.
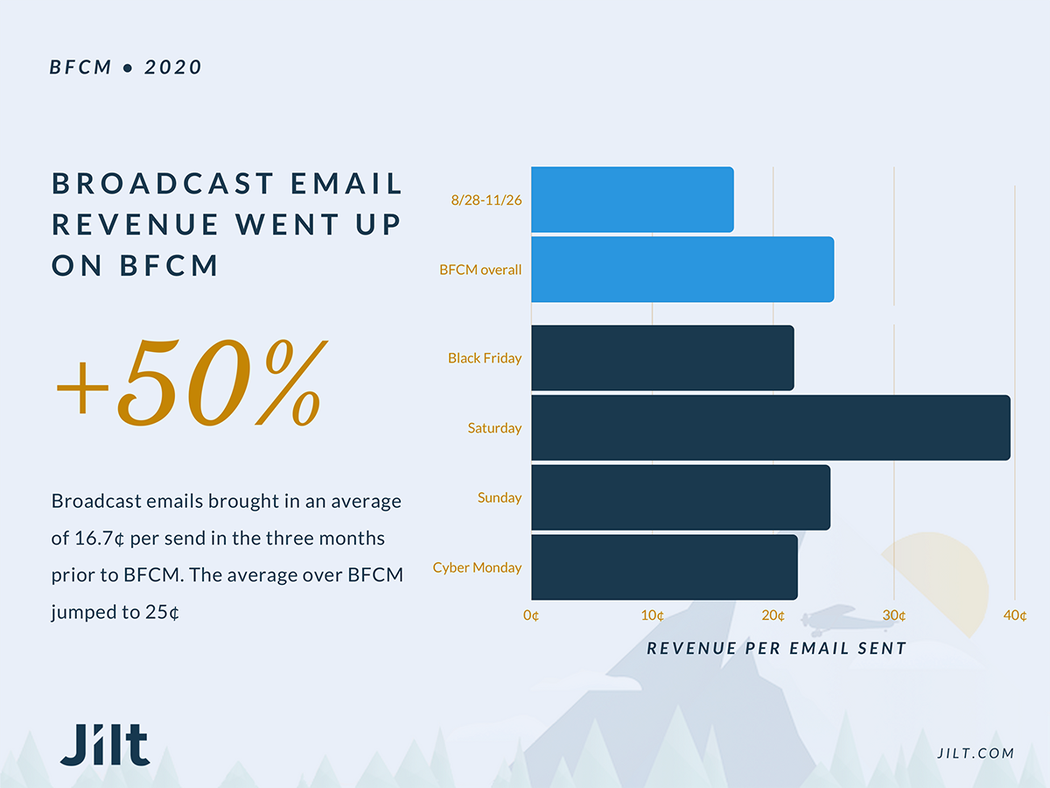
That’s almost exactly a 50 percent increase, which makes a massive difference across the large volume of broadcast emails sent. For instance, a store with a 20,000-subscriber email list could’ve expected attributable revenue of $5,000 per broadcast email over BFCM (a total of $20,000 in attributable revenue at one broadcast each of the four days). During the prior months, those four broadcasts would’ve brought in $6,640 less total revenue.
The large jump on Saturday is notable, and could possibly be attributed in part to Small Business Saturday. The pandemic has increased people’s desire to shop at small businesses, and since the stores using Jilt are almost exclusively small- and medium-sized businesses, it’s quite possible they saw a bigger bump on Small Business Saturday than the enterprise businesses at-large.
The takeaway: Send your broadcast emails on BFCM—and keep sending ‘em. You should see higher average revenue-per-send than you’re used to from those emails. And since we’ve established that a higher BFCM send volume doesn’t typically lead to a higher unsubscribe rate, this is the time to go all-in on frequent broadcasts.
Also, promote yourself as a small business on Small Business Saturday. About one in 10 emails that stores sent with Jilt used the phrase “small business” on Saturday—had more stores promoted themselves that way, Saturday’s surprisingly high revenue-per-email might have pushed even higher.
4. Automated emails were twice as lucrative on BFCM
Automations are the most lucrative emails a store can send—and on BFCM, they became even more valuable.
The seven most popular types of automated emails (welcome new subscribers, cart abandonment, welcome first-time purchaser, thank repeat purchaser, review request, replenishment reminder, win-back) brought in an average of $1.49 in attributable revenue per email sent on BFCM. In the three months prior, those seven automations brought in an average of 74 cents. That means automated emails were twice as valuable on BFCM than any other time of the year.
However, when you dig into the specific automations, some clearly performed better than others during the busiest shopping weekend of the year.
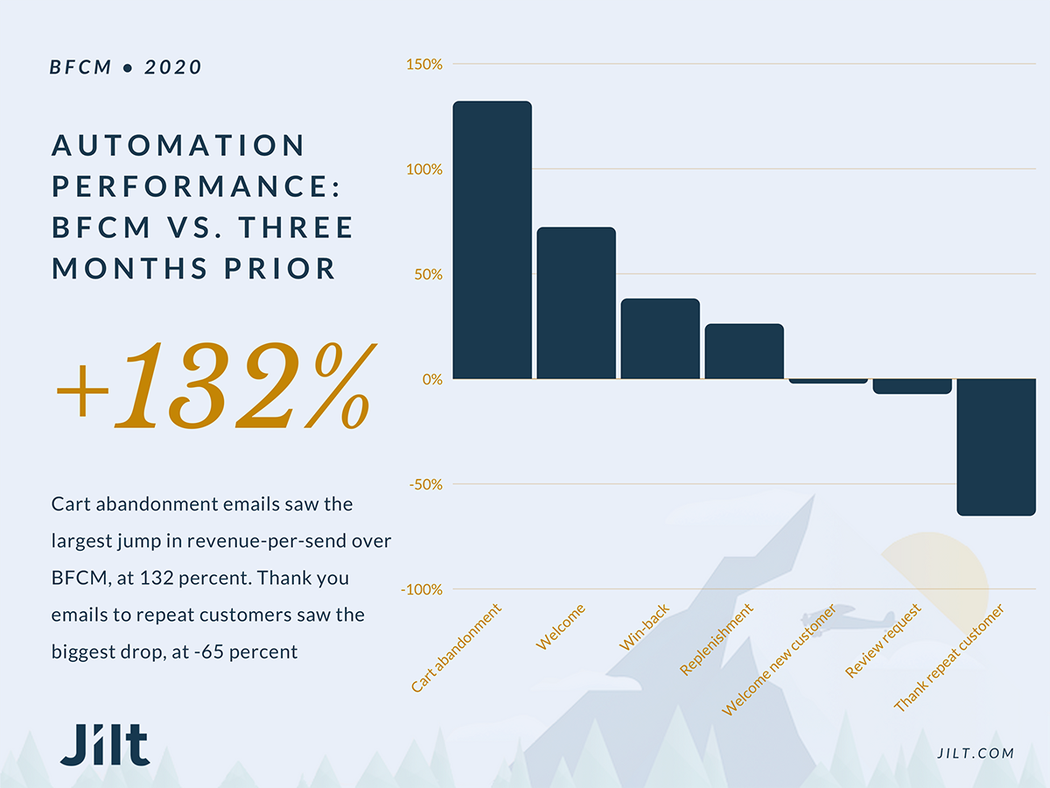
There are four automations that exceeded their averages from the previous three months.
- Cart abandonment emails, 132 percent increase in attributable revenue-per-email
- Welcome new subscribers, 72 percent increase
- Win-back emails, 38 percent increase
- Replenishment reminders, 26 percent increase
Cart abandonment emails also saw noticeably higher open and click-through rates on BFCM than earlier in the year. Open rates were up 25 percent, and click-through rates were up 26 percent.
There are three automations that performed worse on BFCM than during the three-month period prior.
- Welcome emails to first-time customers, 2.4 percent decrease in attributable revenue-per-email
- Product review request, 7.2 percent decrease
- Thank repeat customers, 65 percent decrease
Transactional emails including order receipts and shipping notifications also saw decreases in revenue on BFCM compared to the three months prior. These cases of underperforming emails could all be related; it’s possible customers aren’t looking to make multiple purchases from a store over BFCM, instead they take their time, get everything they need from a store in one visit, and move on to their next shopping destination.
This seems particularly true for the thank you emails to repeat purchasers—no emails saw a bigger performance drop compared to normal than these (a 58 decrease in click-through rate and 65 percent decrease in revenue per email). It seems that repeat customers know what they want from a store on BFCM, so they go to the site, make their purchase, and then mentally check off that store for the weekend to focus elsewhere.
The takeaway: Automations are valuable emails and should be set up before BFCM—even if some might not do as well as they do during the rest of the year. Also, consider tailoring your automated emails around the holidays to try to get even more out of them.
5. BFCM emails outperformed those from prior months—but email marketing holds up quite well during non-BFCM times
Stores using Jilt sent 4.95 million emails on BFCM, and overall, those emails brought in an average of 33.5 cents each in attributable revenue.
And that was, as you’d expect, a better result than during the three preceding months. In the three months prior to BFCM, stores used Jilt to send 10.2 million emails (yes, stores sent nearly half as many emails on BFCM as in the three months prior combined), and those emails brought in an average of 24.6 cents in attributable revenue.
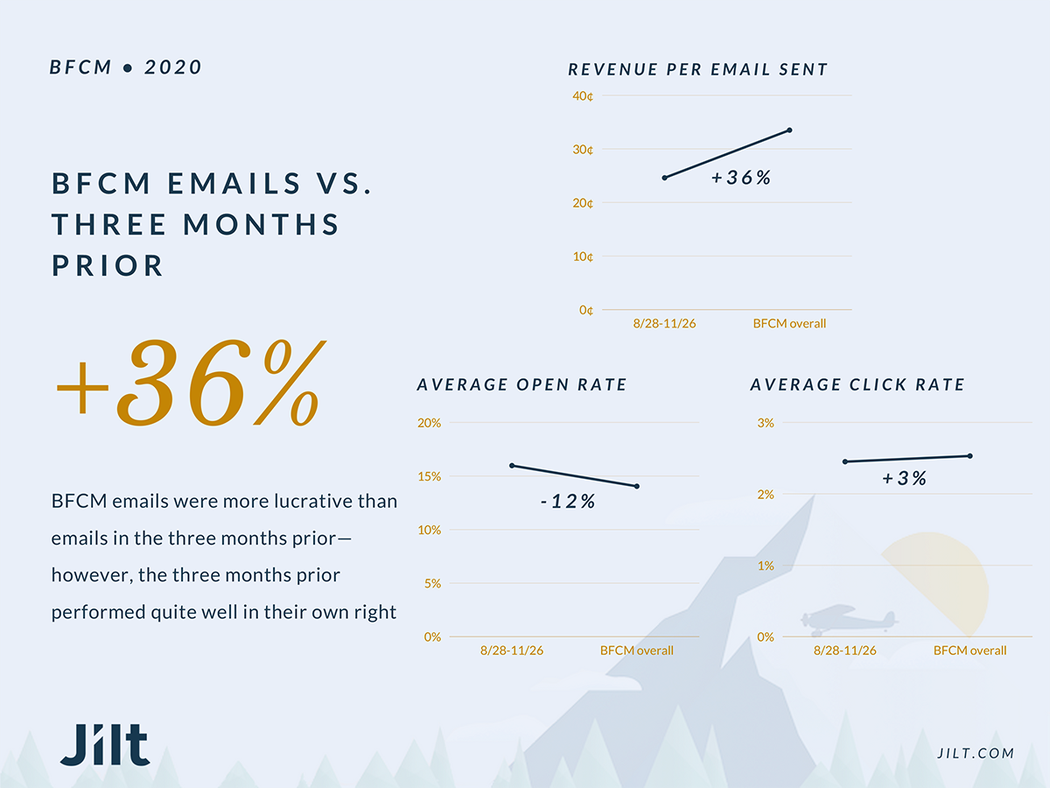
That means emails sent on the four days of BFCM were 36 percent more lucrative than emails sent during the prior quarter—however, it’s not as if email was struggling in the lead up to BFCM. After all, most stores would happily sign up to bring in $1 for every four emails they send..
Email open rate and click-through rate data also reflects email marketing’s stability during the slower months. Open rates on BFCM were 12 percent lower than in the three months prior; click-through rates were three percent higher.
So while email marketing undeniably shines during the busiest shopping weekend of the year, it holds its own quite well during other time periods, too.
The takeaway: Email marketing is always good. Sure, that’s reductive, but it’s not wrong. While email is a key tool during BFCM, it’s also one to focus on throughout the rest of the year as well.
Key takeaways
Once again, online spending on BFCM broke all sorts of records this year—even if it didn’t quite meet the industry’s astronomical expectations.
Some notable industry trends for BFCM 2020 were:
- Broken records everywhere. Americans spent $9 billion online on Black Friday and $10.8 billion on Cyber Monday—both all-time highs. Meanwhile, foot traffic in stores cratered by 52.1 percent—and we’re surprised it wasn’t even lower than that, given the circumstances.
- Spending fell short of expectations. The impact of the pandemic has often been hard to predict, and that was true for eCommerce analysts projecting BFCM. For any number of reasons (economic and more), Adobe has revised its forecast for holiday spending in 2020 from $189 billion to $184 billion.
- Early shopping is here. Between Prime Day in mid-October and lots of stores starting their Black Friday deals early, holiday spending began several weeks before BFCM this year.
- Mobile shopping was flat. This could be another pandemic-related anomaly, but mobile shopping on BFCM did not see the stunning year-over-year growth it had throughout the previous decade. Less travel, fewer family gatherings, and more time at home seemed to lead to lots of shopping on computers.
- The eCommerce giants cleaned up. The biggest players in the eCommerce world saw larger increases in sales on BFCM than smaller retailers. While smaller retailers still did quite well, the gulf between the biggest brands in eCommerce and everyone else looks like it’s continuing to grow.
- Click-and-collect has its moment. Click-and-collect has had a big year, and that continued on BFCM. Click-and-collect orders were up 52 percent year-over-year, and stores offering the service saw better sales growth on BFCM than stores that did not.
- “Boring” shopping is now a significant part of BFCM. People have realized BFCM isn’t just a time to buy big ticket items—it’s also a great time to save money on daily necessities. Categories like pet products, auto parts, food, and personal care all saw at least 2.5x growth on BFCM.
And at Jilt, our data showed how stores leaned into email marketing even more this year than in past years—with fantastic results.
- Higher send volume. Stores sent an average of 234 percent more emails during Cyber Week 2020 than 2019. Open rates were slightly down, and click-through rates were slightly up. And even with the higher send volume, unsubscribe rates actually went down compared to earlier in the year.
- A higher early send volume—with a strong customer response. Jilt stores sent almost two times more emails in the week leading up to BFCM 2020 than in 2019. And customers responded with a 62 percent increase in year-over-year attributable revenue.
- Broadcast emails shined on BFCM. Broadcast emails saw higher-than-usual revenue-per-send on BFCM. The average broadcast brought in 50 percent more revenue-per-send on BFCM than in the three months prior. That difference can really add up across a large volume of emails.
- Some automations shined, others struggled. Cart abandonment emails saw a big increase in opens, clicks, and attributable revenue on BFCM. Welcome emails to new subscribers, win-backs, and replenishment reminders also saw BFCM increases. Three automations saw drops in attributable revenue on BFCM: welcome emails to new customers, review requests, and thank you emails to repeat customers. We have a theory: Customers aren’t looking to make multiple purchases from a store on BFCM—there are just too many other stores to shop from. So encourage shoppers to load up their carts on their first visit, because it might be the only shot you get.
- Email marketing excels on BFCM—but does pretty well for itself the rest of the year, too. Emails on BFCM were, overall, 36 percent more lucrative than emails sent in the three months prior. However, emails from the three months prior still performed quite well—a good reminder that email should be a year-round focus, not just a BFCM special.
Finally, now that BFCM is over, it’s important to think about how you’ll turn your holiday shoppers into year-round customers. And if your email success on BFCM has motivated you to dig even deeper into all that email marketing can offer, check out Jilt Learn, which should quickly become your go-to guide for all things email.
The post 5 things we learned by sending 5 million BFCM emails in 2020 appeared first on GoDaddy Blog.